
by OmegaQuant
You ordered the Omega-3 Index test, collected your sample, and received your report. Now what? This guide explains how to interpret your result and the most reliable ways to raise it—based on published research and large real-world datasets.
Quick Refresher: What the Omega-3 Index Measures
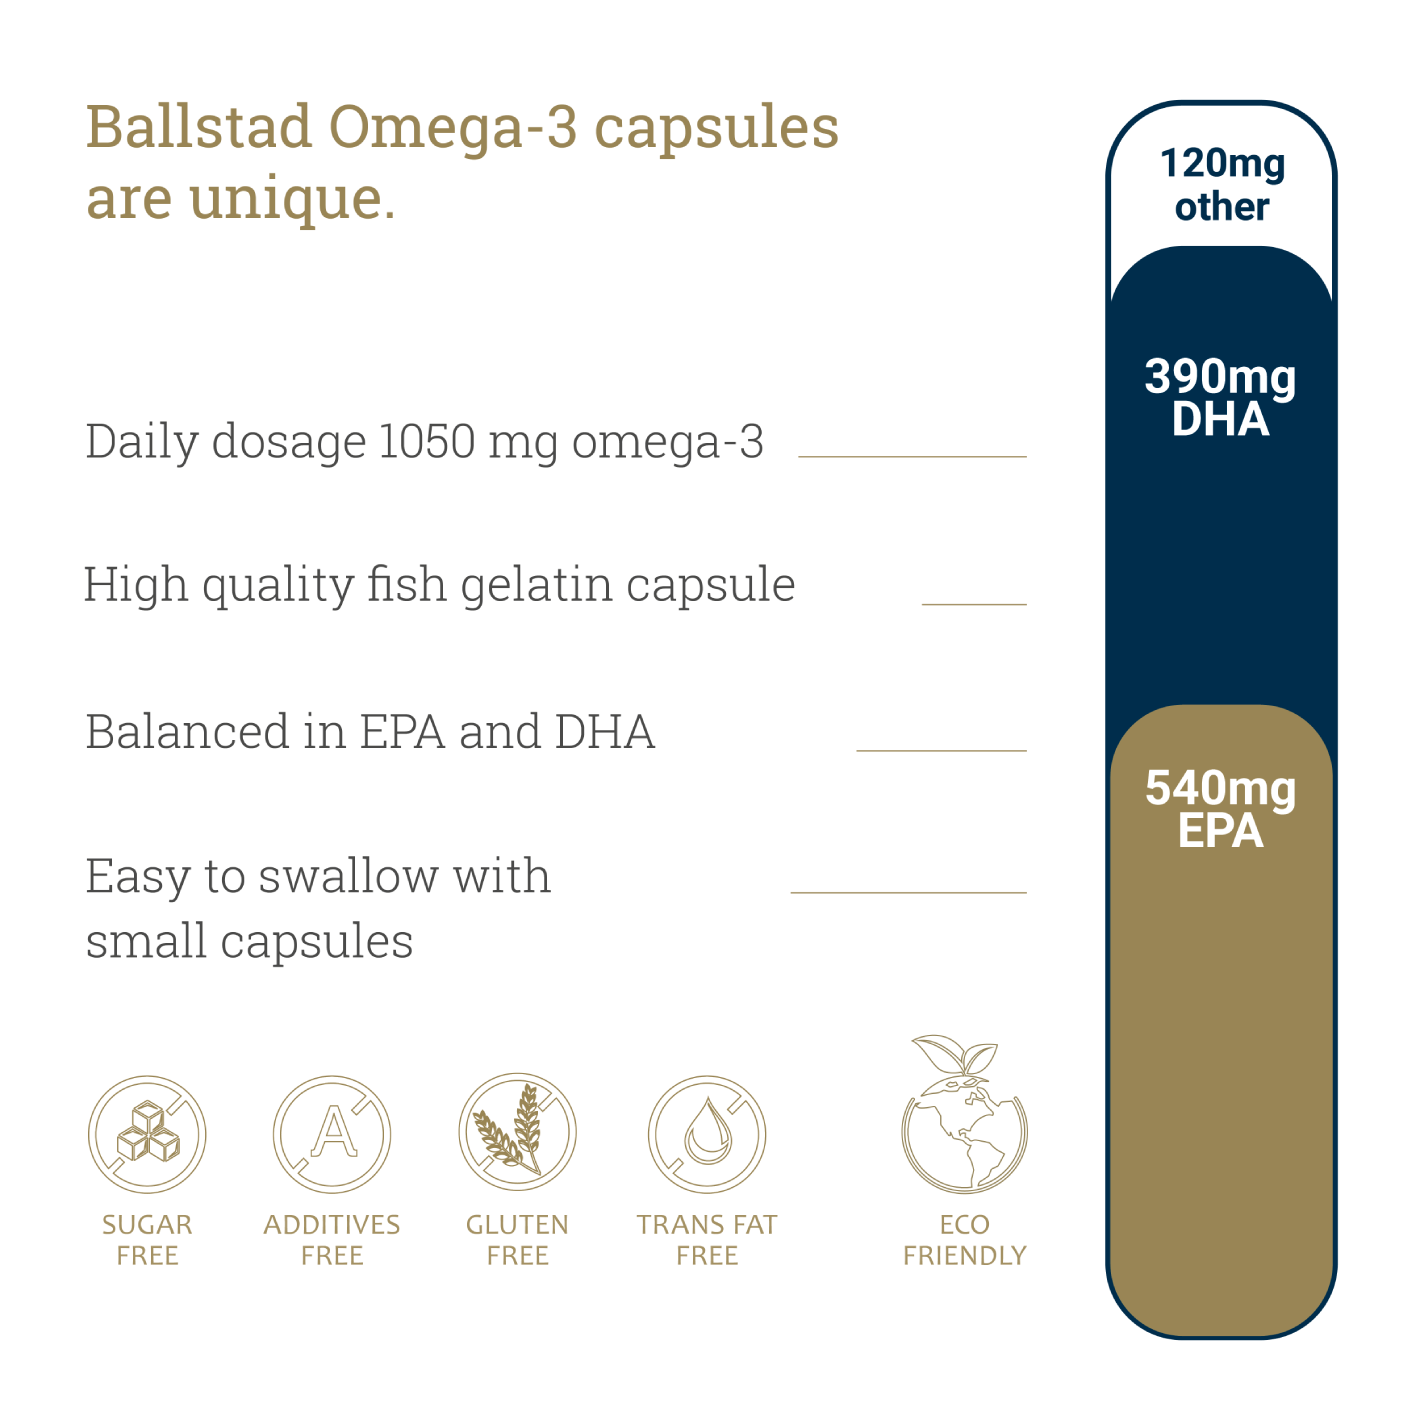
The Omega-3 Index reflects the percentage of the fats EPA (eicosapentaenoic acid) and DHA (docosahexaenoic acid) in your red blood cell (RBC) membranes. We total all fatty acids in the RBC membrane and calculate EPA+DHA as a percentage.
-
Example: a 6% result means 6% of your RBC fatty acids are EPA+DHA.
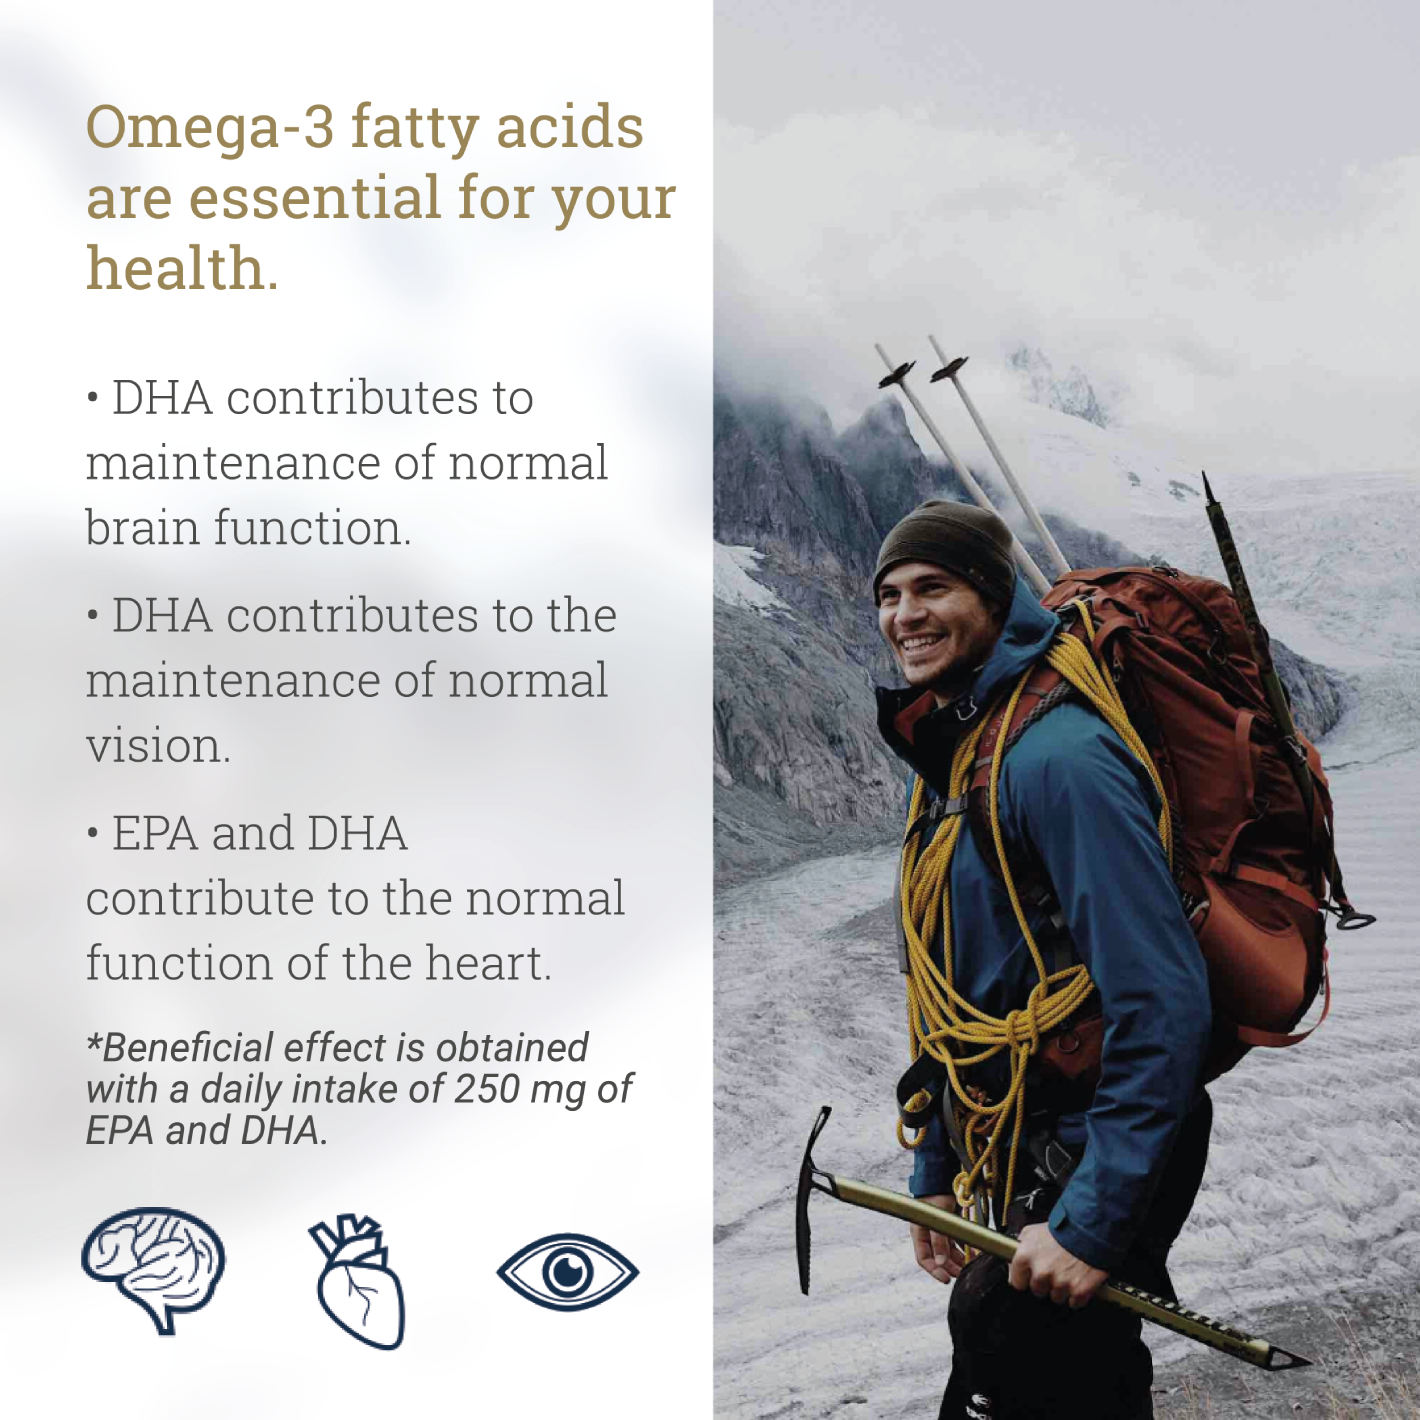
Target range: Most studies associate 8–12% with better outcomes for general wellness, heart, brain, eye, and joint health.
Where Most People Land—and Why
-
The average American’s Omega-3 Index is roughly ~5%.
-
Younger adults tend to have lower levels than older adults; men often test lower than women.
-
Not being at 8% doesn’t mean you’re unhealthy—higher is generally better. Moving from 4% → 6% → 7% is meaningful progress.
What Moves the Needle Most? Intake of EPA + DHA
Two patterns consistently correlate with higher Omega-3 Index values:
-
Eating fish more often, and
-
Taking an EPA/DHA supplement.
Findings from OmegaQuant researchers William S. Harris, PhD, and Kristina Harris Jackson, PhD, RD (nearly 3,500 participants):
-
No fish + no supplements → average Omega-3 Index ~4.1% (considered low).
-
~3 fish meals/week + an EPA/DHA supplement → average ~8.1% (cardioprotective range).
Practical takeaway: In free-living conditions, ≥3 non-fried fish meals/week plus an EPA/DHA supplement most reliably reaches ≥8%.
Using Fish Strategically
Fish vary widely in EPA and DHA. To make food work harder for your number:
-
Prioritize fatty, cold-water species (e.g., salmon, sardines, mackerel, herring).
-
Remember that even “omega-3 rich” fish (e.g., farmed Atlantic salmon) can vary by feed and origin.
-
Use the fish table in your OmegaQuant report (and reputable seafood guides) to choose options with higher EPA+DHA.
Reality check: Diet alone can be a “guessing game.” Testing is the only way to confirm that your choices are impacting your Index.
Choosing and Using Supplements the Smart Way
1) Read the back label—not just “fish oil” on the front
-
Find Serving Size and the EPA and DHA amounts listed separately.
-
Many capsules contain additional fats; focus on total EPA+DHA per day.
2) How much do most people need?
-
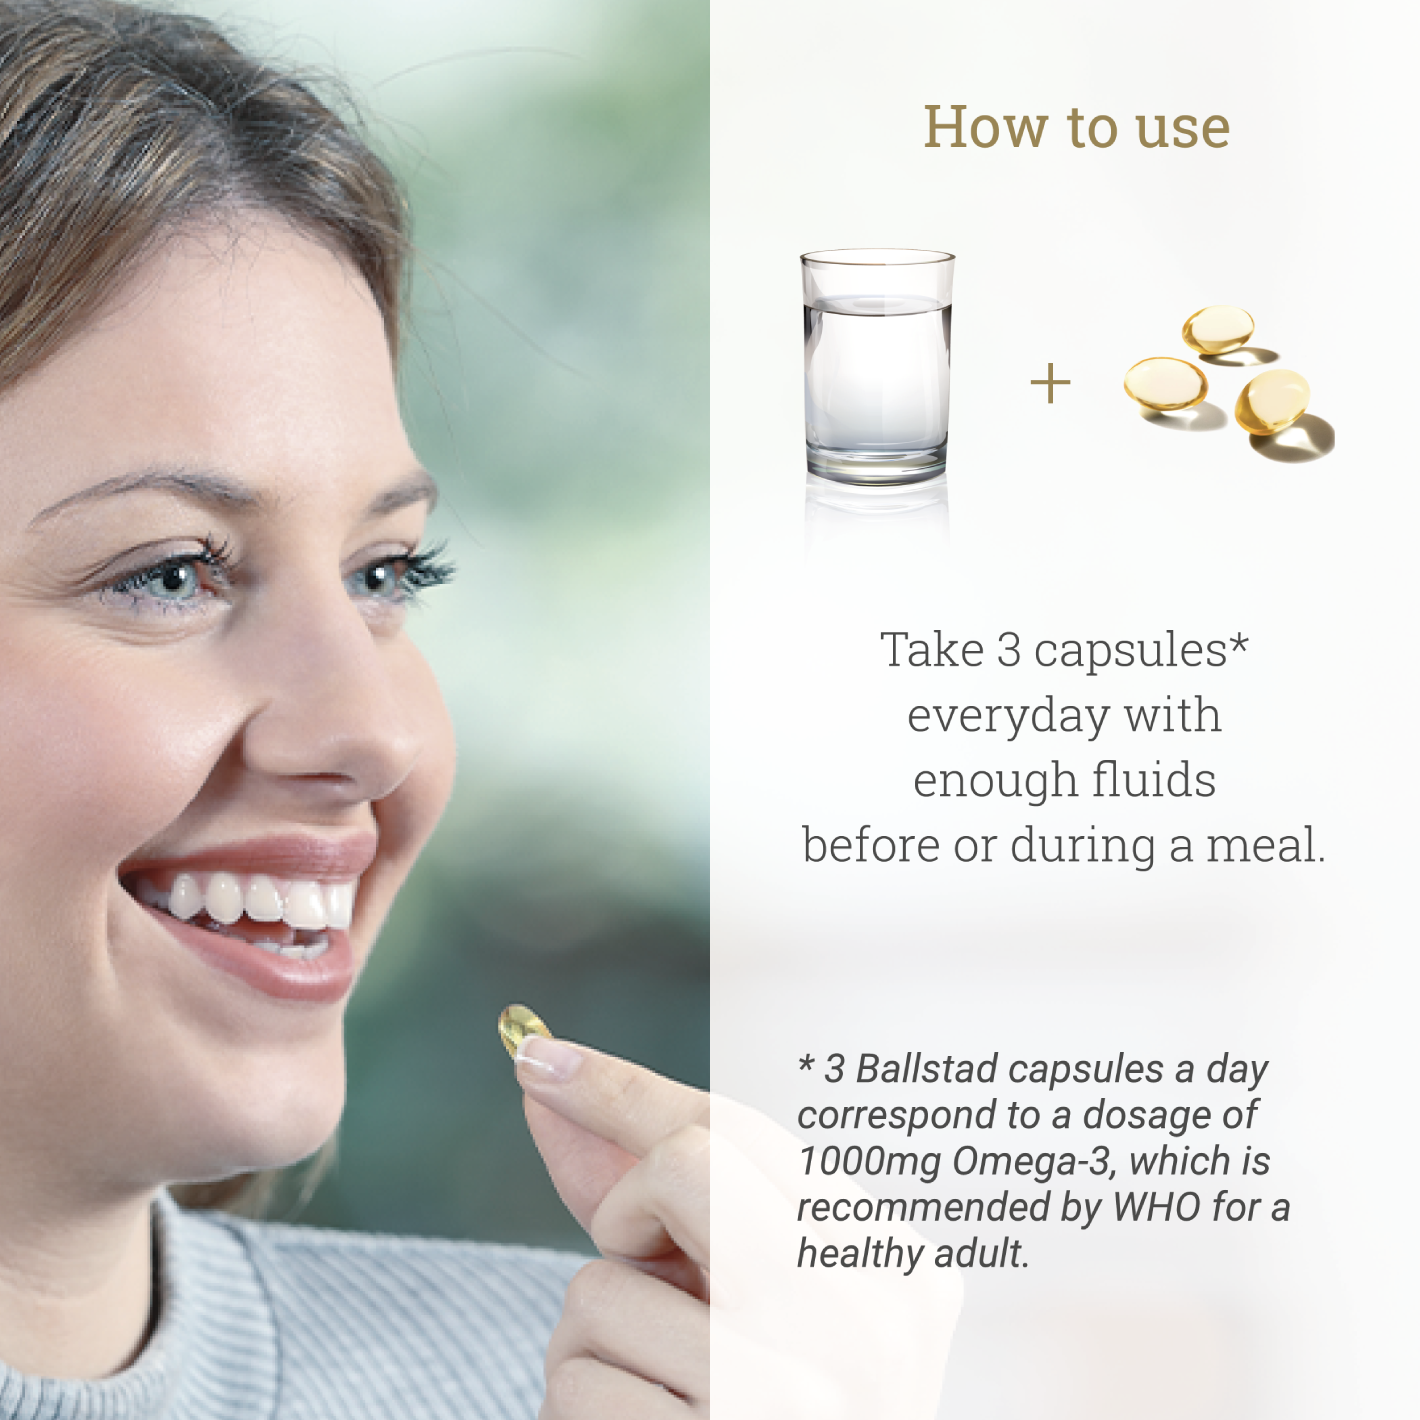
If you’re around 5–6%, a common starting point is ~1,000 mg/day EPA+DHA.
-
Many individuals ultimately need 1,000–2,000 mg/day to reach and maintain ≥8%.
-
Safe upper limits: U.S. up to 3,000 mg/day, EU up to 5,000 mg/day (combined EPA+DHA).
Consistency matters more than perfection. Think in weekly totals (like fish meals): if you take more one day and miss the next, your average still counts.
3) Take with a meal that contains fat
-
Co-ingestion with dietary fat improves absorption for many formulations.
4) Forms and formats
-
Better-absorbed (in general): triglyceride and phospholipid forms; liposomal/emulsified can help.
-
Ethyl esters can still be effective but often require with-fat dosing.
-
Form matters—but dose and adherence move your Index most.
5) Personalize with data
-
Use OmegaQuant’s omega-3 calculator: enter your current Index and target to estimate the added EPA/DHA needed.
-
Example modeling (13 weeks, triglyceride forms):
-
Baseline 2% → ~2,200 mg/day EPA+DHA to reach 8%
-
Baseline 4% → ~1,500 mg/day
-
Baseline 6% → ~750 mg/day
-
Can Your Omega-3 Index Be Too High?
An upper “risk” threshold isn’t established. Populations with naturally higher indices (e.g., Japan averaging ~9%) have lower heart disease despite other risk factors. OmegaQuant recommends 8–12% because it’s the best-studied range; levels >12% are less common in datasets, so evidence is limited—not necessarily harmful.
What About Plant-Based Omega-3s?
-
ALA (from walnuts, flax, chia) converts poorly to EPA and especially to DHA. It’s healthy, but inefficient for raising the Omega-3 Index.
-
Algal DHA supplements are vegan and effective for boosting DHA; many people benefit from algal DHA ± EPA to raise the Index without fish.
When to Re-Test
-
Every 3–4 months while you’re changing diet/supplement routine (that’s the RBC turnover window the Index reflects).
-
Once stable, every 6–12 months to ensure you’re maintaining your target range.
-
Track subjective changes (e.g., dry eye, joint comfort) alongside your numbers.
Talk With Your Clinician
If you ordered your test online, discuss results and dosing with your healthcare provider—especially if you take medications or have medical conditions. Generally, fish and EPA/DHA supplements are considered low-risk interventions.
Why Trust OmegaQuant?
-
CLIA-certified lab methods, validated against RBC measures.
-
The Omega-3 Index methodology has been used in 200+ studies and cited in hundreds more.
-
Ongoing collaborations with 100+ research institutions to refine targets and condition-specific insights.
Action Plan Summary
-
Check your starting point (your Omega-3 Index).
-
Aim for 8–12% for broad health support.
-
Increase EPA+DHA intake via high-EPA/DHA fish and/or a clearly dosed supplement.
-
Take with a fat-containing meal to improve absorption.
-
Re-test in 3–4 months and adjust dose using your new result (and the calculator).
If you want, share your current percentage and weekly fish/supplement routine, and I’ll propose a data-driven EPA/DHA plan to reach your target—plus a retesting schedule.